

Abstract
The carbon intensity (CI) of corn ethanol, the primary renewable fuel used in transportation, has been actively researched and quantified over the last three decades. Reliable estimates of greenhouse gas (GHG) emissions for corn ethanol are important since these values help determine significant policy and market decisions on state, national, and international levels. We reviewed well-to-wheel GHG life cycle analyses (LCAs) for corn ethanol and evaluated models, input data, and results for farming, fuel production, co-product credit, land use change (LUC), transport of feedstock and fuel, tailpipe, and denaturant. Compared to earlier analyses, recent LCAs for corn ethanol contain updates to modeling systems and data that reflect: (a) market-driven changes in corn production that lowered the intensity of fertilizer and fossil fuel use on farms; (b) more efficient use of natural gas and recent electric generation mix data for energy consumed at ethanol refineries, and (c) LUC analyses based on hybrid economic-biophysical models that account for land conversion, land productivity, and land intensification. LCAs that include these latest developments yield a central best estimate of CI for corn ethanol of 51.4 gCO2e MJ−1 (range of 37.6–65.1 gCO2e MJ−1) which is 46% lower than the average CI for neat gasoline. The largest components of total CI are ethanol production (29.6 gCO2e MJ−1, 58% of total) and farming practices net of co-product credit (13.2 gCO2e MJ−1, 26%), while LUC is a minor contributor (3.9 gCO2e MJ−1, 7%). Market conditions that favor greater adoption of precision agriculture systems, retention of soil organic carbon, and demand for co-products from ethanol production may lower the CI of corn ethanol further. Continued refinement of models to account for co-products, conservation of soil carbon, and direct and indirect LUC is expected to produce ever more accurate estimates in the future.
Export citation and abstract BibTeX RIS

Original content from this work may be used under the terms of the Creative Commons Attribution 4.0 license. Any further distribution of this work must maintain attribution to the author(s) and the title of the work, journal citation and DOI.
1. Introduction
The Renewable Fuel Standard (RFS) program, authorized by the Energy Policy Act of 2005, aims to reduce greenhouse gas (GHG) emissions, expand the nation's renewable fuels sector, and reduce reliance on imported oil [1]. The RFS required that transportation fuels sold in the United States contain 7.5 billion gallons (BG) of renewable fuels by 2012 [2]. In 2007, the Energy Independence Security Act expanded the RFS (referred to as RFS2) and required transportation fuels to contain 36 BG by 2022, with 15 BG coming from conventional biofuels and 21 BG from advanced biofuels [3].
Ethanol produced from corn starch (hereafter 'corn ethanol') is currently the primary conventional renewable fuel used in transportation fuels [4]. Ethanol demand in the United States increased from 3.6 BG in 2004 to 14.4 BG in 2019 [5]. Given this significant expansion, accurate characterization of the GHG profile of corn ethanol is important for evaluating impacts of the RFS and related low carbon fuel initiatives. Estimates for the carbon intensity (CI) of corn ethanol over the past three decades range from approximately 105 grams of carbon dioxide equivalent emission per megajoule of energy (gCO2e MJ−1) in 2009 to approximately 52 gCO2e MJ−1 in more recent years [2, 6–14]. The estimates published since 2010 represent a reduction of approximately 20% to 40% in GHG emissions relative to conventional 2005 gasoline, the benchmark comparison in life cycle analyses (LCAs) published by the Environmental Protection Agency (EPA) and the United States Department of Agriculture (USDA) [2, 7]. Identifying the basis of these estimates and reasons for the differences among them is important because the CI values are used to inform significant policy and market decisions on state, national, and international levels.
To address this need, we conducted a state of the science review of the CI for corn ethanol in the United States and derived an evidence-based central CI estimate and credible range as of 2020. We compared our result to CI values for corn ethanol reported in generally accepted, widely used LCAs published as of 2010 and identified the principal reasons for any notable differences observed. This review of CI for corn ethanol is intended to inform analyses of the role for corn ethanol as a transportation fuel in the decarbonization of the United States economy and to facilitate communications on biofuel production, policy, and use.
2. Methods
We searched the peer-reviewed and grey literature to identify existing well-to-wheel LCA analyses, models, parameter values, and data on overall corn ethanol CI and its components for the United States. We focused on well-to-wheel LCAs because they use a generally accepted approach for assessing GHG impacts of a transportation fuel and examine each stage of corn ethanol production and use [15]. We also focused on stand-alone analyses of LCA components to capture the latest developments in LCA models and the associated input parameters. To supplement the literature review, we interviewed over two dozen biofuel LCA experts in academia, government, not-for-profit, and commercial organizations in the United States and Canada. This search strategy yielded 23 LCA models [2, 7–14, 16–26] and over 30 supporting publications that we used to develop a structure for subsequent critical review and analysis.
We consolidated the numerous LCA components into nine emission categories: farming, co-product credit, fuel production, land use change (LUC), rice methane, livestock, fuel and feedstock transport, denaturant, and tailpipe. Preliminary review of the data showed that farming and co-product credits, fuel production, and LUC account for over 90% of the CI of corn ethanol. For each of those major categories we: (a) critically reviewed previously developed CI estimates; (b) evaluated and recalibrated inputs and assumptions to reflect the current state of the science; and (c) selected models and parameters deemed to provide the most reliable results based on our analysis of their strengths and weaknesses (described in the results). The screening process generally produced fewer than ten CI values for each emission parameter, all of which we considered equally likely and valid. We defined the minimum and maximum values as the range of credible values for each parameter and the midpoint between the minimum and maximum values as the central best estimate. Information on methods employed for each of the major categories is provided next.
For LUC, we critically reviewed 26 CI values published since 2008 and evaluated the underlying agro-economic model, economic data year, yield price elasticity (YDEL), and incorporation of land intensification [2, 7–10, 12–14, 27–40]. We assigned a binary indicator of current best practice (yes or no) to each LUC model or parameter using criteria informed by peer-reviewed literature, empirical analysis, and input from our panel of external experts. Next, we selected the CI outputs for international LUC (iLUC), domestic LUC (dLUC), and total LUC from the sources that met our criteria for best practice. We also calculated an updated dLUC emission value using the recently released 2020 Argonne National Lab (ANL) Carbon Calculator for Land Use Change from Biofuels Production (CCLUB) model. We summed the values for iLUC and dLUC to develop a central estimate and credible range for total LUC.
For farming, we primarily drew upon analyses and data in the Greenhouse Gases, Regulated Emissions, and Energy Use in Transportation (GREET) model, the most widely used tool and database over the prior 10 years for assessing GHG emissions from corn ethanol in the United States [41]. We reviewed recent GREET-based assessments [7, 9, 10, 12–14] and compared their emission estimates to calibrated data from the Ecoinvent database version 3.5 [42]. We selected Ecoinvent as a useful and transparent database to thoroughly assess farming emissions because: (a) its data sources and assumptions are well documented; (b) it is publicly available; and (c) when used in conjunction with LCA software, it allows for assessment of process contributions, identification of key drivers of emissions, determination of the impact of assumptions and parameters on the analysis, and scenario analysis. We calibrated the Ecoinvent data to reflect current farming practices more accurately. We determined the range and central estimate of farming emissions from the parameter values in GREET and Ecoinvent. To account for farming co-product credits, we followed methods in accordance with the International Organization for Standardization (ISO) 14044 standard for LCAs and determined a credible range and central estimate [43].
For ethanol production, we relied upon documented energy emissions factors and data on regional electricity grid mixtures and process fuels used to power refining and co-product operations. We evaluated fuel production model assumptions used in well-to-wheel LCAs and compared them to current processes of the United States corn ethanol refining industry. Following the model evaluation, we derived a range and central estimate for fuel production emissions and validated our estimates using data from an ANL 2018 survey that collected responses from 65 corn ethanol dry mill facilities located across 17 states in the United States [44].
For the remaining direct GHG emissions categories (fuel and feedstock transport, tailpipe, and denaturant emissions), we derived a range and central estimate from the information provided in the selected attributional and consequential LCAs included in our analysis. Attributional LCAs consider the direct emissions associated with the full supply chain of corn ethanol production and its consumption [2]. Consequential LCAs consider direct as well as indirect emissions from potential changes to resources (e.g. rice and livestock) expected to result from changes in the production or consumption of corn ethanol [2]. To calculate the CI of corn ethanol in our study, we followed an attributional approach (i.e. included direct emissions), with the addition of consequential LUC emissions, since those emissions have been historically considered as large contributors to the CI of corn ethanol [2, 7, 10, 27]. Thus, we calculated the total CI of corn ethanol by summing the central estimates for seven emission categories (LUC, farming, co-product credit, fuel production, fuel and feedstock transport, tailpipe, and denaturant), as well as the upper and lower bounds of the credible ranges.
3. Results
All well-to-wheel GHG LCAs identified by our literature search were produced by government organizations or investigators, while studies on specific components of LCAs, such as LUC and farming emissions, were primarily published by academic-based investigators. Of the former, we identified three LCAs issued by California Air Resources Board (CARB) [8–10]; one by EPA [2]; two by USDA [7, 26]; and annual reports from ANL for 2010–2020 [11–14, 16–25]. The total CI values for corn ethanol from most of those LCAs are presented as a time series in figure 1, along with contributions from the three principal components: corn production and transportation (i.e. farming), ethanol production and transportation, and LUC. The plot demonstrates two-fold variability among CI values for corn ethanol over the 20 year period, but also convergence toward lower CI values for corn ethanol in total and among each of the principal components.
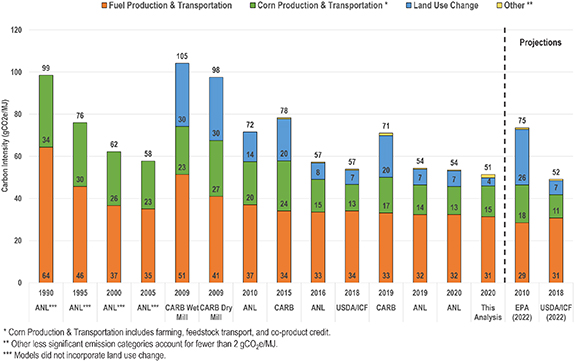
Figure 1. Timeline of estimated corn ethanol life cycle GHG emissions for 1990 through 2020 with projections out to 2022.
Download figure:
Standard image High-resolution imageExamination of figure 1 shows that some of the variability among estimates of total CI over time is explained by differences in system boundaries of the LCAs. The LCAs released by ANL from 1990 through 2005 only consider GHG emissions arising directly from the life cycle of corn ethanol, i.e. from farming and ethanol production, whereas LCAs published after 2005 also consider emissions that could occur indirectly in response to changes in corn ethanol production and demand, i.e. LUC [2]. Expanding the system boundary to include LUC increases the CARB and EPA estimates of total CI for corn ethanol by 40% to 55% over the combined CI of farming and ethanol production [2, 8–10]. In comparison, the ANL and USDA estimates of CI associated with LUC are lower and equivalent to approximately 15% to 25% of the combined CI for farming and ethanol production [7, 11–14]. Estimates for LUC CI are reviewed in section 3.1.
Further examination of figure 1 shows a consistent, but not monotonic, decrease in CI for farming and ethanol production which also explains a portion of the variability in total CI values over time. Estimates of the CI for both farming and ethanol production decreased by approximately 50% from peaks of 34 gCO2e MJ−1 and 64 gCO2e MJ−1 in 1990, respectively [6]. The decrease in farming emissions is primarily a result of practice improvements, such as a 35% reduction in nitrogen fertilizer use and 40% reduction in fossil fuel consumption from 1990 to 2005 [40]. The reduction in GHG emissions from ethanol production stems primarily from more efficient use of energy at corn ethanol plants with energy use intensity dropping by approximately 50% (15 to 7.5 gigajoules per cubic meter of ethanol) from 1990 to 2010 [40]. Except for the analysis by CARB in 2015, CI estimates published after 2010 have converged on approximately 30 gCO2e MJ−1 for ethanol production and 13 gCO2e MJ−1 for farming, with the latter including a co-product credit from displacement of conventional animal feeds such as corn, soybean meal, and urea by distillers grain solubles (DGS) generated as a by-product of ethanol production.
We review variability of the CI estimates for LUC, farming, ethanol production, and remaining categories in the remainder of this paper. Those evaluations focus on LCA analyses published as of 2010 and relevant peer-reviewed papers. These inclusion criteria exclude earlier LCAs from ANL and CARB that are superseded by more recent analyses, while capturing the only LCA published by EPA and key publications on LUC and petroleum-based gasoline. In addition, we excluded ANL LCAs prior to 2013 since they were not available in a transparent format, and their LCAs from 2013 and 2015 since they are incorported into CARB's 2015 and USDA's 2018 analyses, respectively. We selected LCAs by ANL we thought to be representative of more recent practices. We also excluded USDA's 2017 LCA since their 2018 analysis was an amended and updated analysis which relied upon the same ANL 2015 modeling.
Results from the LCAs as of 2010 included in our analysis are summarized in table 1. Aggregate CI scores for corn ethanol range from 52.1 to 78.3 gCO2e MJ−1, including the two projections for 2022. The net CI for farming, ethanol production, and co-product credits comprise approximately 70% of the total CI in each analysis. Transportation of feedstock and ethanol as well as tailpipe emissions from end-user vehicles were also similar across the LCAs and together account for about 4 gCO2e MJ−1 and 7% of total CI. The LCAs differed in the remaining emissions categories. LUC CI varied four-fold among individual analyses, from 6.7 to 26.3 gCO2e MJ−1. Emissions associated with addition of a denaturant to ethanol were considered in only two of the LCAs and indirect effects on rice methane emissions and livestock emissions were considered in only three of the LCAs. We examine these emission categories in the following sections, beginning with LUC.
Table 1. GHG emissions (gCO2e MJ−1) reported by LCAs for corn ethanol produced in the United States.
| Model | CARB 2015 | ANL 2016 | USDA 2018 | CARB 2019 | ANL 2019 | ANL 2020 | EPA 2010 projection for 2022 | USDA 2018 projection for 2022 |
|---|---|---|---|---|---|---|---|---|
| GREET model | CA-GREET 2.0 (GREET1_2013) | GREET1_2016 | GREET1_2015 | CA-GREET 3.0 (GREET1_2016) | GREET1_2019 | GREET1_2020 | GREET_1.89c (2009) | GREET1_2015 |
| GHG emission categories | ||||||||
| Fuel production | 30.2 | 32.3 | 32.7 | 30.7 | 31.3 | 31.4 | 26.5 | 29.4 |
| Farming (domestic and international a , including chemicals) | 34.4 | 27.7 | 22.8 | 28.0 | 26.0 | 25.6 | 16.0 | 21.3 |
| Co-product credit | −12.6 | −12.2 | −12.1 | −12.6 | −13.4 | −13.5 | Included in farming emissions | −11.4 |
| Fuel and feedstock transport | 5.9 | 2.7 | 3.3 | 3.9 | 2.5 | 2.2 | 4.0 | 2.5 |
| Tailpipe | 0.0 | 0.5 | 0.6 | 0.1 | 0.5 | 0.5 | 0.8 | 0.6 |
| Total land-use change (domestic and international) | 19.8 | 7.9 | 6.7 | 19.8 | 7.5 | 7.4 | 26.3 | 6.7 |
| Rice methane (domestic and international) | — | — | 1.4 | — | — | — | 1.8 | 1.4 |
| Livestock (domestic and international) | — | — | 1.6 | — | — | — | −0.3 | 1.6 |
| Denaturant | 0.6 | — | — | 1.1 | — | — | — | — |
| Total CI in gCO2e MJ−1 | 78.3 | 58.9 | 57.0 | 71.0 | 54.4 | 53.6 | 75.1 | 52.1 |
a International farming only considered by USDA and EPA.ANL: Argonne National Lab.CARB: California Air Resources Board.EPA: United States Environmental Protection Agency.GREET: The Greenhouse Gases, Regulated Emissions, and Energy Use in Transportation model.GHG: Greenhouse gas emissions.USDA: United States Department of Agriculture.CI: Carbon intensity.gCO2e MJ−1: Gram carbon dioxide equivalent emission per megajoule [2, 7, 9, 10, 12–14].
3.1. Land use change (LUC)
We identified 26 CI values for LUC of corn ethanol published since 2008. As shown in figure 2, these values decreased from 104 gCO2e MJ−1 to generally less than 10 gCO2e MJ−1 from 2008 to 2020 [2, 7–10, 12–14, 27–40]. The LUC values appear to be converging although a moderate degree of variability remains among models and analyses. Variability among the LUC estimates stem primarily from differences in four major elements that comprise these CI values: the agro-economic model, economic data year, YDEL, and land intensification. Our evaluation of these elements is presented next and details are provided in tables S.1–S.4 (available online at stacks.iop.org/ERL/16/043001/mmedia) in the supplemental materials.

Figure 2. Timeline of estimated GHG emissions associated with corn ethanol-related LUC, 2008–2020.
Download figure:
Standard image High-resolution image3.1.1. Agro-economic models
Agro-economic models predict demand for agricultural commodities globally in response to changes in supply and are used to assess LUC following increases in production of biofuels [45]. The LCAs for corn ethanol that we reviewed rely upon one of three agro-economic models: Forestry and Agricultural Sector Optimization Model (FASOM), Food and Agriculture Policy Research Institute (FAPRI), and Global Trade Analysis Project-Biofuels (GTAP-BIO). While having a common endpoint, these models differ in their geographic scope, method used to predict land conversion, and consideration of land cover categories. These characteristics and others translate to comparative strengths and weaknesses of the three models.
As shown in table S.1, EPA (2010) relied upon FASOM to characterize LUC within the United States (dLUC) and FAPRI elsewhere in the world (iLUC) [2]. FASOM was developed with a focus on dLUC and has not been widely adopted in LCAs for corn ethanol [46, 47]. Further examination of table S.1 shows that FAPRI was used in three analyses that we reviewed, one for iLUC only and for total LUC in the other two. GTAP-BIO was used to estimate dLUC, iLUC and total LUC in the remaining 22 analyses.
For land conversion, FAPRI predicts changes in crop acres by country globally, but does not have land type interactions built into the model [2]. To predict land specific crop acres, FAPRI relies upon Moderate Resolution Imaging Spectroradiometer (MODIS) satellite imagery data which has been demonstrated to misclassify agricultural and non-agricultural lands, resulting in inaccurate predictions of land types that convert to cropland and unreliable emission estimates associated with LUC [2, 47]. In contrast, land conversion in GTAP-BIO is based upon hybrid economic-biophysical models that account for both the quantity and quality of available agricultural land to predict how much land of each land cover category is actively used in production and how much land is idle during a specific time period [45, 48]. GTAP-BIO accounts for climate-specific crop yields and three soil quality indicators to generate land productivity and land supply curves that are calibrated to historical crop productivity figures [49]. GTAP-BIO also considers multiple categories of land use, including idle cropland and cropland pasture, that allow for application of land use-specific GHG emission factors. This feature is particularly important for simulating return to production of land in the USDA Conservation Reserve Program [50].
Based on our review of the literature, GTAP-BIO appears to be the field-leading model for LUC because it addresses both dLUC and iLUC, predicts LUC for specific land types using both economic and physical data, is incorporated into the generally accepted GREET model from ANL, and has been adopted for use in LUC analyses for the California Low Carbon Fuel Standard (LCFS) [51]. For these reasons, we marked LUC estimates derived from the GTAP-BIO model as meeting our best practice criteria (table S.1).
3.1.2. Economic data year
The economic data year is the baseline point in time used in agro-economic models for estimating LUC of corn ethanol. The year of the economic data is significant because the agro-economic model is 'shocked' with an expansion of a specified volume of corn ethanol. The volumes which shock the model are determined by the difference between 15 BG, the RFS2 mandated volume target for conventional biofuels, and the volume of ethanol produced in the United States during the specific economic data year [1, 52]. Three world economic data years were used in the analyses that we reviewed: 2001, 2004, and 2011. The modeled expansion in production volume of corn ethanol is approximately 13.25 BG for economic data year 2001, 11.6 BG for 2004, and 1.1 BG for 2011. Eighteen of the 26 LUC analyses that we reviewed used 2004 as the economic data year, while four used 2001, and one used 2011. We selected 2004 as the most appropriate economic data year for this review, because it captures the largest period of corn ethanol volume expansion in the United States and is relied upon the most frequently. We marked models using 2004 as meeting our best practice criteria (table S.1).
3.1.3. Yield price elasticity
YDEL describes the percentage change in crop yield per unit of land per percentage change in price for the crop and is a key driver of LUC outputs from agro-economic models [53]. The CARB LCFS expert workgroup recommended a YDEL of 0.25 for the United States and 0.3 for Brazil and Argentina, where multiple cropping is likely to occur, and 0.175 for countries that do not practice multiple cropping [54]. Multiple cropping is defined as growing two or more crops on the same land in the same season or year [55]. Taheripour et al (2017) reviewed crop yield data from 19 regions around the world and derived a recommended YDEL range of 0.175–0.325 [35, 56]. We examined YDEL for corn reported in 20 studies published from 1976 to 2017 and calculated a simple average of 0.23 (table S.2) [2, 28, 34, 35, 57–66]. From these data, we determined a YDEL central best estimate of 0.25 and credible range of 0.175–0.325. Eighteen analyses that we reviewed had YDEL values within this range and we marked them as meeting our best practice criteria (table S.1).
3.1.4. Land intensification
Land intensification is the practice of using existing cropland more efficiently and is defined as activities undertaken with the intention of enhancing the productivity or profitability per unit area of land [67]. Examples of land intensification include yield improvement, multiple cropping, reduction of agricultural land in fallow, conversion of other unused cropland to crop production, and reduction in temporary or mowed pasture [68]. According to an empirical analysis of agricultural land use across the globe, land intensification accounted for two thirds (49.1/73.1 million hectares) of the observed increase in harvests from the period 2004–2006 to 2010–2012 rather than conversion of timberland and pasture to farm land [68], while the United States corn ethanol production increased over three-fold during that period (4.0–13.5 BG) [5]. Similarly, an empirical analysis of agricultural land from 2003 to 2013 found the ratio of harvested area over available land area increased in 17 of the 19 worldwide regions, indicating that land intensification increased globally rather than only in a minor fraction of locations [56]. Another empirical study found that from 2002 to 2017, agricultural land area in the United States declined by 38 million acres while land intensification increased harvested area by 17 million acres and annual ethanol production increased by 13.8 BG [5, 69]. These studies indicate that land intensification is an important and common response to increased demand for corn ethanol production. Only five of 26 analyses that we reviewed considered land intensification and we marked them as meeting our best practice criteria (table S.1).
In addition to reviewing previously developed LUC estimates, we calculated an updated dLUC CI value to incorporate the recently released 2020 CCLUB model developed by ANL into this review and applied land transformation parameters [33]. The land transformation parameters considered regionally specific land transformation elasticities and land-specific costs of converting pasture or forest to cropland [33]. We set 2004 as the economic data year and ran the 'Corn Ethanol 2013' feedstock to fuel pathway which was calibrated with land transformation parameters. Additional inputs for the CCLUB run are provided in the table S.3. Our analysis returned a CI for dLUC of −2.3 gCO2e MJ−1.
The dLUC, iLUC, and total LUC CI values identified as meeting our best practice criteria are shown in table 2. We summed the two dLUC values with the iLUC values selected from our critical review to determine an overall credible range of LUC of −1–8.7 gCO2e MJ−1 from which we calculated a central best estimate of 3.9 gCO2e MJ−1.
Table 2. LUC analyses, models and outputs identified as meeting current best practice for LCA of corn ethanol.
| Study | Year | Parameter | LUC value (gCO2e MJ−1 ) | Merits |
|---|---|---|---|---|
| USDA—2018—ICF | 2018 | dLUC | −1.9 |
|
| This analysis | 2020 | dLUC | −2.3 |
|
| USDA—2018—ICF | 2013 | iLUC | 8.0 |
|
| USDA—2018—ICF | 2013 | iLUC | 1.3 |
|
| Taheripour | 2017 | LUC | 8.7 |
|
ICF: ICF International.dLUC: Domestic land use change.iLUC: International land use change.LUC: Total land use change.GTAP-BIO: Global Trade Analysis Project-Biofuels.gCO2e MJ−1: Gram carbon dioxide equivalent emission per megajoule [7, 33, 35].
3.2. Farming and co-product credits
LCAs for corn adopt a cradle-to-gate scope, including both on-farm emissions as well as those from the full supply chains associated with on-farm processes including fertilizer and chemical use, disturbance of farming soils, and fossil fuel and electrical energy use. LCAs published since 2010 estimate the CI for farming differ by as much as a factor of 2 and range from 16.0 to 34.4 gCO2e MJ−1. These estimates are based upon versions of the GREET model released from 2013 to 2020, as shown in table 1, and user-specified values for selected model parameters. We examined the farming components of these versions of GREET and the modeling scenarios to determine whether they meet our criteria for characterizing CI of corn ethanol as of 2020.
Examination of table 1 shows that the most recent estimate of farming CI from CARB is 6.4 gCO2e MJ−1 lower than CARB's prior estimate and the largest difference among all CI estimates within a category other than LUC. Based on information from CARB, the decrease is primarily attributable to adoption of lower energy intensity for farming (6924 British thermal unit (Btu) bushel−1 in the 2019 estimate compared to 9608 for the 2015 estimate) and lower fertilizer intensity (383 gallons of nitrogen fertilizer per bushel for 2019 compared to 423 gallons bushel−1 for 2015) [70]. For its 2019 analysis, CARB adopted the default values that are in GREET1_2016 for these inputs [70]. According to the developers of GREET, the default values in GREET1_2016 are significant updates to earlier versions of GREET and are based upon new analyses of fertilizer intensity and farming energy data from the USDA Agricultural Resource Management Survey (ARMS) in 2010 and 2012 [71, 72]. Changes to these inputs will necessarily influence the overall CI results for farming because emissions of nitrous oxide (N2O) from cycling of nitrogen fertilizer in corn fields, production of fertilizer, and direct energy use for fuel and electricity are the largest components of GHG emissions for growing and harvesting corn [40]. Based on this information, we determined the CARB 2015 CI value for farming does not meet our best practice criteria and omitted it from further analysis. For similar reasons, we also omitted the EPA 2010 projection for farming emissions of 16 gCO2e MJ−1 projected to occur in 2022. And lastly, we omitted the USDA projection for farming emissions in 2022 of 21.3 gCO2e MJ−1 because it assumes numerous farming practice improvements that have yet been demonstrated to be widely adopted, including residue and tillage management, nutrient management, and cover crops.
To further evaluate the reliability of the farming results from these LCAs, we reviewed farming CI using a source of data independent of GREET, the Ecoinvent database of GHG emissions [42]. Table 3 shows the GREET and Ecoinvent farming model parameters ranked according to their contribution to the overall farming emissions. The major contributors to farming emissions are chemical supply chain, N2O emissions from nitrogen fertilizer and nitrogen in crop biomass, and co-product credits.
Table 3. Farming parameters ranked by magnitude of impact on farming emissions.
| Category a | Farming model parameters | Emissions (gCO2e MJ−1) | ||
|---|---|---|---|---|
| Default Ecoinvent | Adjusted Ecoinvent | GREET models | ||
| Small (1–5 gCO2e MJ−1) | Soil CO2 from urea and lime | 0b | 0b | 0b–2.8 |
| Irrigation energy | 4.2 | 0.8 | 0b | |
| Harvest drying | 16.7 | 2.0 | 0b | |
| Seed drying | 4.5 | 3.3 | 0b | |
| On-farm fossil fuel use | 3.3 | 3.3 | −2.7 | |
| Large (5–15 gCO2e MJ−1) to Very large (>15 gCO2e MJ−1) | Chemicals, supply chain | 8.7 | 8.7 | 7.9–11.2 |
| N2O emissions from soils | 11.1 | 11.1 | 10.2–13.9 | |
| Co-product credit | — | — | −12.1 to −13.5c | |
a Categories are based on adjusted Ecoinvent and GREET models. b 0 indicates that at least one source either omitted this model parameter or reported it as part of on-farm fossil fuel use. c Included the default method use in GREET. —Ecoinvent does not specify a co-product credit. gCO2e MJ−1: Gram carbon dioxide equivalent emission per megajoule. References [6, 7, 9, 10, 12–14, 42].
Ecoinvent uses data from studies by the National Renewable Energy Lab (NREL) and USDA as inputs for modeling United States corn production [73–75]. Ecoinvent contains the central estimates of average quantities of input per unit of output from the NREL and USDA studies, with two exceptions: irrigation and on-farm drying of corn grain after harvest. We evaluated both of those model inputs using current data on average United States corn farming practices.
The Ecoinvent dataset reflected full use of irrigation, with a water use intensity of 0.24 m3 water per kilogram (kg) of corn produced. However, not all United States farms use irrigation and national average water use intensity varies from year to year. We analyzed data from the USDA's ARMS database for all available survey years since 1996 [76]. The fraction of irrigated corn acres ranged from 11.5% to 15.7% across these years. We combined ARMS data on water inputs with data on annual corn production from the USDA Feed Grains database [77] to generate water use intensities of 0.03–0.06 m3 kg−1 since 2000. We observed a declining trend during that period. The central estimate of this range, 0.045 m3 kg−1, represents 20% of the irrigation intensity input (0.24 m3 kg−1) used in Ecoinvent. Using our updated water use intensity estimate, we calculated the adjusted Ecoinvent CI contribution of irrigation to be 0.84 gCO2e MJ−1 instead of the original estimate of 4.2 gCO2e MJ−1.
Analogous to its treatment of irrigation, the Ecoinvent model assumed that 100% of corn grain required active fuel-based drying plus fans to lower grain moisture content from 39% at harvest to 14% at storage [42]. Farmers may also use passive drying (without fuel) in the field prior to harvest, which yields a lower starting moisture content. We compared the assumption of 39% moisture at harvest with historical data on corn moisture at harvest for the United States from 2010 to 2017 [78]. Annual averages in the United States ranged from 16.3% in 2010 to a high of 19.7% in 2013, with an 18% average over the entire period. A target moisture level of 14% for storage is also conservatively low; CARB and EPA cite storage moisture content levels of 15% and 15.5%, respectively [79, 80]. We adjusted the model to reflect the measured harvest moisture level of 18%, and a target moisture content of 15%, and retained the conservative assumption that 100% of farmers pursue active drying to achieve this moisture reduction. The result is an adjustment of drying's CI contribution from 16.7 gCO2e MJ−1 to 2 gCO2e MJ−1.
The Ecoinvent database is transparent at the unit process level, with over 1000 separately examinable processes contributing to the full supply chain for United States corn production. Upon examination of the models we detected that the supply chain for seed included a duplicate instance of seed drying; drying with the same amount of fuel use and emissions appeared both prior to, and then after, aggregation of the seeds at market. Removing this error caused a minor adjustment to the CI contribution of seed drying, from 4.54 gCO2e MJ−1 to 3.27 gCO2e MJ−1.
After updating data in Ecoinvent to reflect current United States corn farming practices in relation to irrigation, harvest drying, and seed drying, the CI for corn farming decreased by nearly 20 gCO2e MJ−1 (figure 3). The resulting adjusted Ecoinvent CI of 29.2 gCO2e MJ−1 was within ±6 gCO2e MJ−1 of the recent GREET-based CIs (figure 4).
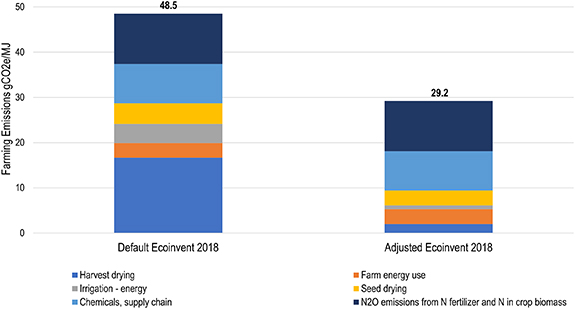
Figure 3. Comparison of farming emissions produced from the default and adjusted Ecoinvent 2018.
Download figure:
Standard image High-resolution image
Figure 4. Comparison of sources of farming emissions across models produced from adjusted Ecoinvent and GREET.
Download figure:
Standard image High-resolution imageTo account for farming co-product credits, we followed methods used in the well-to-wheel LCAs and determined a credible range and central estimate in accordance with the ISO 14044 standard for LCA [43].
We considered the emission co-product credit from DGS in our analysis, since DGS is a co-product of corn ethanol production and is sold to the animal feed market. The method selected for allocating co-product credits in LCAs can make a major difference on the CI estimates of co-product credits. A recent comparison found that co-product credits ranged from −8 to −24 gCO2e MJ−1 based on the allocation method used [6]. The ISO 14044 standard for LCAs recommends a hierarchy of methods for addressing co-product credits [43]. The preferred approach is the system expansion or displacement method followed by causal modeling, and then by allocation of process burdens among co-products based on parameters such as the co-product shares of process revenues.
Even when using the preferred method (i.e. the displacement method), there will still be some variability in co-product credits for the corn-based ethanol life cycle for two reasons; first, because the DGS can be used to displace a variety of products, whose corresponding footprints (and thus co-product credits to the ethanol system) vary considerably; and second because corn ethanol production also yields co-products which can displace alternative production. DGS sold as animal feed can displace urea, and corn and soybean meal in different quantities depending on which type of livestock is being fed [9, 10, 12–14]. Ecoinvent data show the carbon footprint of soybean meal to be 0.07 kg CO2e kg−1, which is more than twice the value of 0.032 kg CO2e kg−1 given for corn meal as energy feed [42]. In addition, corn ethanol production yields at least two additional byproducts: food grade CO2, which can displace alternative production of food grade CO2 [81]; and corn oil, which can substitute for other vegetable oils [82] or can replace fossil-fuel-based inputs in applications such as asphalt paving [83, 84].
In this analysis, we conservatively focus on the displacement of feed products by the DGS co-product, and we follow the displacement ratios given in the GREET model for a mix of beef, dairy, swine, and poultry feed. ANL, CARB, and USDA rely upon the GREET displacement method ratios. EPA did not include information on their negative emissions associated with the DGS co-product. The negative emissions associated with displacement of feed products by the DGS co-product produced by ANL, CARB, and USDA using GREET range from −13.5 to −12.1 gCO2e MJ−1 (a maximum absolute difference of 1.3 gCO2e MJ−1), with a central estimate of −12.8 gCO2e MJ−1 (table 3). We adopt the value of −12.8 gCO2e MJ−1 which is based on the livestock-specific displacement ratios for soybean meal, corn and urea, for a mix of primarily beef and dairy feed, plus 13% swine and 6% poultry [9, 10, 12–14].
In summary, our review and analysis generated an overall range for farming emissions from 22.8 to 29.2 gCO2e MJ−1 with a central estimate of 26.0 gCO2e MJ−1, derived from recent GREET-based analyses and our independent analysis using data in Ecoinvent. We also considered the emission co-product credit from DGS in our analysis and generated a central estimate of −12.8 gCO2e MJ−1 with range of −13.5 to −12.1 gCO2e MJ−1 based on analyses from ANL, CARB, and USDA using GREET that conform with the ISO 14044 standard for addressing co-product credits in LCAs.
3.3. Ethanol production
LCAs for corn ethanol published since 2010 estimate the CI of corn ethanol production to range from 26.5 to 32.7 gCO2e MJ−1 (table 1). GHG emissions associated with biofuel production depend on the types of refining processes used to make ethanol from corn, the energy use intensity of those processes, and the sources and types of fuel used to provide the power.
There are two prominent refining processes for producing corn ethanol: dry milling and wet milling. In dry milling, the grain kernel is ground into meal which is followed by the starch hydrolysis and fermentation processes [45]. Dry milling refineries produce ethanol, DGS, and when incorporated into operations, the extraction of corn oil [82]. In contrast, the first step in wet milling is to soak grain kernel to separate the kernels from the hulls after which the kernels are further separated into fiber, gluten, and starch [85]. Wet milling refineries produce ethanol, and the resulting fiber and gluten are processed separately to produce feed products [85]. According to data from USDA, approximately 91% of United States refineries are dry milling plants and 9% are wet milling plants [86]. Wet milling provides higher ethanol fuel yields than dry milling [12–14], but requires more capital investment and is estimated to be over 75% more energy intensive [12–14, 20, 22, 87].
As shown in table S.4 in the supplemental materials, most of the analyses shown in table 1 assumed that 89% of refineries were dry mills which is consistent with the distribution of dry mill facilities in the U.S [86, 87]. Other models, such as CARB 2015, EPA 2010, and USDA 2018 (projected for 2022) estimated the CI for corn ethanol production assuming 100% dry milling. According to the models, electricity consumed from the grid accounts for approximately 10% of energy needs at the refineries with the remaining 90% powered by process fuels [2, 7, 9–14, 88, 89]. In these models, the primary process fuel is natural gas, with a share of 72.5% to 100% of process fuel energy use among refineries with coal accounting for the balance. Both natural gas and biomass are more energy efficient than coal; however, biomass is not widely used due to high fuel and capital costs [90].
The fuel production emissions produced by ANL, CARB, USDA, and EPA are consistent with one another with a maximum difference of approximately 6 gCO2e MJ−1. To evaluate those values further, we calculated production CI using data from the recently published ANL 2018 survey of 65 corn ethanol dry mill facilities located across 17 states in the United States and compared the result to the ethanol production values in table 1 [44]. The facilities surveyed reported average consumption of 24 310 Btu of natural gas per gallon of ethanol, 0.747 kilowatt-hour of electricity per gallon of ethanol, and no use of coal [44]. These rates correspond to 27.8 gCO2e MJ−1 of fuel production emissions at an average dry mill corn ethanol facility, a value that is in the lower end of the range of estimates produced by ANL, CARB, USDA, and EPA. The facilities in the survey sample may not be representative of the entire population of corn ethanol producers given that they are all dry mill facilities and none of them reported use of coal. Nonetheless, these recently available survey data corroborate the inputs on energy use intensity and energy type for the models that we reviewed. Based on these observations, we find a reasonable central estimate and credible range of CI for corn ethanol production of 29.6 gCO2e MJ−1 and 26.5–32.7 gCO2e MJ−1, respectively.
3.4. Other direct emission categories
The remaining GHG emission categories reviewed and updated were fuel and feedstock transport, tailpipe, and denaturant emissions. The fuel and feedstock transport category consists of emissions associated with the combustion of gasoline and diesel fuels during the transport of corn from farm to refinery and corn ethanol from refinery to retail station. The tailpipe category consists of emissions from the combustion of corn ethanol in transportation vehicles. Corn ethanol-based CO2 emissions from tailpipes are assumed to be biogenic and offset by carbon uptake during new biomass growth [7]. Corn ethanol combustion also emits methane (CH4), nitrous oxide (N2O), and volatile organic compounds, which are included in modeling of corn ethanol tailpipe emissions.
CI values for fuel and feedstock transport and tailpipe emissions across the ANL, CARB, EPA, and USDA models average 3.4 and 0.5 gCO2e MJ−1, respectively (table 4). Together, these two categories represent about 6% of the overall CI score for most of the analyses. Although only a modest contributor to overall CI, the CI estimates vary by nearly three-fold for transport of feedstock and fuel (2.2–6.0 gCO2e MJ−1) and nine-fold for tailpipe emissions (0.09–0.83 gCO2e MJ−1). The variation across those ranges primarily reflects two factors: updates to the national input parameters and CA-specific versus national input parameters. We first address transport emissions and then tailpipe emissions.
Table 4. Other direct emission modeling produced by ANL, CARB, USDA, and EPA.
| CARB 2015 | ANL 2016 | USDA 2018 a | CARB 2019 | ANL 2019 | ANL 2020 | EPA 2010 (2022) | USDA 2018 (2022) a | |
|---|---|---|---|---|---|---|---|---|
| GREET model | CA-GREET 2.0 (GREET1_2013) | GREET1_2016 | GREET1_2015 | CA-GREET 3.0 (GREET1_2016) | GREET1_2019 | GREET1_2020 | GREET_1.89 c (2009) | GREET1_2015 |
| Fuel and feedstock transport | ||||||||
| Feedstock transport (gCO2e MJ−1) | 2.06 | 1.49 | 1.86 | 1.5 | 1.55 | 1.2 | — | 1.16 |
| Fuel transport (gCO2e MJ−1) | 3.86 | 1.19 | 1.39 | 2.6 | 0.99 | 0.98 | — | 1.34 |
| Feedstock and fuel transport (gCO2e MJ−1) | 6.0 | 2.7 | 3.3 | 4.1 | 2.5 | 2.2 | 4.0 | 2.5 |
| Tailpipe | ||||||||
| CH4 emissions (gCO2e MJ−1) | — | 0.06 | 0.29 | — | 0.06 | 0.06 | 0.25 | 0.29 |
| N2O emissions (gCO2e MJ−1) | — | 0.47 | 0.26 | — | 0.47 | 0.47 | 0.58 | 0.26 |
| Tailpipe emissions (gCO2e MJ−1) | 0 | 0.52 | 0.55 | 0.09 | 0.52 | 0.52 | 0.83 | 0.55 |
a USDA values include emissions associated with transport of fuel, feedstock, distillers grains, and corn oil.gCO2e MJ−1: Gram carbon dioxide equivalent emission per megajoule.CARB: California Air Resources Board.USDA: United States Department of Agriculture.EPA: United States Environmental Protection Agency.CH4: Methane.N2O: Nitrous oxide [7, 9, 10, 12–14, 91].
Inspection of table 4 shows that feedstock and fuel transport emissions in the GREET models decreased by 15% to 25% with the release of GREET1_2016. The changes in GREET reflected a new analysis that accounted for closer proximity of corn farms to ethanol plants resulting from a five-fold increase in the number of production facilities in the Midwest corn-growing states and a shift from truck-dominated to rail-dominated delivery of ethanol [71]. The rapid expansion of ethanol in gasoline across the United States as of 2010 was the driving force for both the proximity effect and rail effect cited in the new analysis [72]. The difference between the CARB 2019 value of 4.1 gCO2e MJ−1 and the values from ANL of 2.2–2.7 gCO2e MJ−1 stem from adjustments made by CARB to fuel economy and cargo payload of trucks, tankers, and barges that convey ethanol [70]. In consideration of these updates to GREET, we adopt a credible range of 2.2–4.1 gCO2e MJ−1 and central value of 3.1 gCO2e MJ−1 for CI of fuel and feedstock transport.
Additional inspection of table 4 shows that CI for tailpipe emissions in the CARB 2015 and CARB 2019 LCAs are approximately five-fold lower than corresponding CI from ANL, EPA, and USDA. This difference reflects the lower emission standards in California compared to United States standards according to CARB [70]. The projection for 2022 made by EPA in 2010 is an outlier compared to the relatively consistent estimates issued by ANL since 2016, therefore we omitted the EPA value from further consideration. Given these results, we adopted a credible range of 0.09–0.55 gCO2e MJ−1 with a central value of 0.3 gCO2e MJ−1 for tailpipe emissions.
The final emission category that we assessed is the small amount of denaturant added to ethanol, approximately 2% by volume, to render it undrinkable [2, 92]. Denaturant was considered by CARB in its 2015 and 2019 LCAs but has yet to be included in LCAs from EPA, ANL, or USDA. CARB calculates the emissions associated with denaturant using a formula with CI inputs that include farming, co-product credit, fuel production, and fuel and feedstock transport. The calculated denaturant value is inversely related to the CI of the other emission categories. The California GREET 2.0 model estimated a denaturant CI of 0.55 gCO2e MJ−1 [9] and the CA-GREET 3.0 model estimated a denaturant value of 1.12 gCO2e MJ−1 [10]. We used the CA-GREET 3.0 approach to estimate CI for denaturant associated with the central estimate CI values from our analysis and computed a value of 2.0 gCO2e MJ−1. We used the minimum and maximum of these three values to define the credible range for denaturant CI as 0.55–2.0 gCO2e MJ−1 with a central estimate of 1.3 gCO2e MJ−1.
3.5. Carbon intensity of corn ethanol
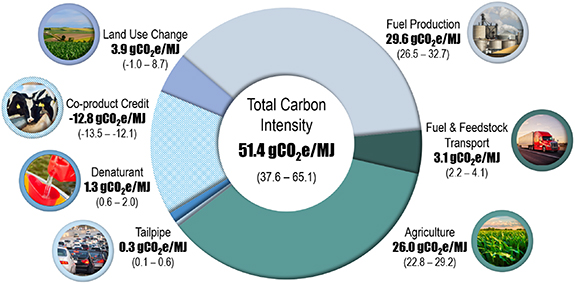
Using the central estimates and ranges of LUC, farming, co-product credit, fuel production, fuel and feedstock transport, tailpipe, and denaturant emissions described in the preceding sections, we estimate the CI of corn ethanol to be 51.4 gCO2e MJ−1, with an overall range of 37.6–65.1 gCO2e MJ−1 (figure 5). Our findings for fuel and corn production and transportation are consistent with the decreasing and converging trend of GHG emission estimates that is apparent in the scientific literature (figure 1).
Figure 5. GHG emission categories and total CI of corn ethanol.
Download figure:
Standard image High-resolution image
4. Discussion
We reviewed peer-reviewed publications and grey literature reports on well-to-wheel GHG LCAs and studies on specific components of LCAs that characterize CI for corn ethanol produced in the United States. ANL, CARB, USDA, and EPA are the four major organizations that produce LCAs for corn ethanol in the United States. Their estimates of corn ethanol CI decreased by approximately 50% over the prior 30 years although not uniformly. Estimates for GHG emissions from farming and production of ethanol fall within 20% of each other among the organizations. In addition, estimates of CI for farming and ethanol production that we produced from two independent sources of information corroborated the results from the four government organizations. However, treatment of LUC is less consistent among the organizations, with variability of approximately 70% among organizations. Our review indicates that estimates for CI of LUC from ANL and USDA are based upon more reliable methods and data than those from EPA and CARB. Overall those estimates produced by ANL and USDA of CI converge to a central best estimate of approximately 55 gCO2e MJ−1. Notably, some authors have generated lower and higher estimates of CI for corn ethanol than those evaluated here, but those assessments are for specific combinations of regions and technologies while our aim was to characterize emissions for the United States [93, 94].
Modeled emissions from corn production and transport (including farming, feedstock transport, and co-product credit) decreased by approximately 14 gCO2e MJ−1 between 1990 and 2010 and stabilized in the last decade, with all recent estimates from CARB, ANL, USDA, and EPA in the range of 10.5–24.4 gCO2e MJ−1 (figure 1). The downward trend of corn production emissions is explained by improvements in farming practices and LCA methods. In the past few decades, corn yield has increased and fertilizer application per bushel of corn has decreased as a result of crop and nutrient management strategies, such as use of nitrogen inhibitors and precision agriculture [7, 76, 95]. According to USDA National Agriculture Statistics Service, the use of nitrogen fertilizer in grams per bushel of corn decreased by over 20% in the majority of 'United States Corn Belt' states (Illinois, Indiana, Iowa, Nebraska) between 2000 and 2018 [96]. Farm energy use decreased by approximately 8% on a per bushel basis from 2005 to 2010, a downward trend that is likely to have continued since 2010 [97]. The GREET model used to characterize farming emissions has also improved to quantitatively account for soil organic carbon, which tends to lower GHG emissions from corn farming [98]. Inclusion of co-product credit associated with corn oil as a biodiesel feedstock contributed to the downward trend of corn production and transport emissions as well [99].
GHG emissions associated with farming practices net of co-product credit constitute a relatively large share (26%) of the total CI for corn ethanol, therefore, additional improvements that reduce the cradle-to-gate footprint of corn production would improve the CI of corn ethanol further. Greater adoption of techniques for precision-based application of fertilizers offer significant economic as well as environmental benefits [100, 101]. The total cradle-to-farmgate CI for corn produced from states in the upper Midwest, which supply the bulk of corn to ethanol production, could be reduced in the region by up to 74% by adopting conservation tillage, reducing nitrogen fertilizer use, and implementing cover crops [102]. The implementation of land management practices such as cover crops and manure application can increase storage of organic carbon in soil [103]. Results of improved management practices for soil organic carbon (SOC) have been shown to depend on regionally variable factors including climate and soil characteristics, indicating the need and opportunity to pursue improvement management practices on a regionally tailored basis [103]. Biofuel policies that give farmers and corn ethanol producers incentives to adoptenvironmentally beneficial practices, are expected to result in wider use of those practices. In addition to reflecting current SOC practices, we recommend that future GREET models update inputs on energy sources used in corn production, since the current GREET model relies upon a 2015 USDA study that used farming data from 2010 [97]. One other recommendation arising from our review is that Ecoinvent update its dataset on United States corn production to reflect current average practice and more recent data, particularly for irrigation and grain drying.
Modeled emissions from ethanol production and transport decreased by approximately 27 gCO2e MJ−1 between 1990 and 2010 and stabilized in the last decade, with all recent estimates from CARB, ANL, USDA, and EPA falling within 28.5–34.1 gCO2e MJ−1 (figure 1). Models used to estimate fuel production emissions have also been updated to include more current inputs for electrical generation mix data and more accurate distribution of plant types. However, the latest fuel production models still use electrical generation mix datasets that are either dated or based on estimated projections; and assume the distribution of fuel types (e.g. natural gas, coal) and plant types (e.g. dry mill, wet mill) are either 100% dry mill and natural gas or have remained static since 2016 (table S.4). We recommend future studies validate the energy input and plant distribution data as they play a significant role in the determination of fuel production GHG emissions.
Since GHG emissions associated with producing ethanol account for 58% of the total CI for corn ethanol, additional production improvements related to co-products (DGS, CO2, and corn oil) and alternative energy sources (biomass, biogas, and wind and solar energy) can play a significant role in reducing the overall CI of corn ethanol. Transitioning to 100% wet DGS can result in about −10 gCO2e MJ−1, due to savings in avoided energy associated with drying DGS [104]. Carbon dioxide, a co-product from the corn ethanol fermentation process, can be sequestered or captured and sold for uses elsewhere, such as in the beverage industry, and could result in up to −30 gCO2e MJ−1 by avoiding CO2 emissions being released or generated [81, 104]. Corn oil as a co-product can also lead to carbon credits if it displaces soy oil and if it is used as a pavement additive, which could extend the useful life of asphalt pavements [83, 84]. The use of alternative energy sources such as biomass, dairy or swine biogas, and solar or wind energy can result in up to approximately −20 gCO2e M−1 [13], −65 gCO2e MJ−1 [105], and −5 gCO2e MJ−1 [79] CI credits, respectively. We estimated the maximum potential CI credit for biomass by substituting natural gas as the energy source used for fuel processing and drying of DGS in GREET [106]. We assumed biomass to be biogenic and its emissions as negligible, and did not consider the emissions associated with the processing and transport of biomass, nor the impact of corn stover as biomass on fertilizer use. We estimated the potential CI credit associated with biogas using 2019 LCFS pathways submitted to CARB for review [105], but did not consider logistical concerns regarding the supply and transport of sufficient biogas to refineries. We determined the CI potential of wind or solar power using CA-GREET [79], which includes wind and solar as emission free energy source options. The use of wind and solar power is not a feasible option to replace major energy sources such as natural gas but could be applied to specific refinery processes. We recommend continued research on the feasibility and impact of alternative co-product production processes, energy sources, and process fuels such as biomass, biogas, and wind and solar energy.
Modeled emissions from LUC decreased from 30.0 to 14.0 gCO2e MJ−1 between 1990 and 2010 and have continued to decrease for LCAs from USDA and ANL (figure 1), due to modeling and land management improvements. Modeling improvements include refinements to GTAP-BIO, the field-leading agroeconomic model, use of appropriate YDEL values (0.175–0.35), and inclusion of land intensification. Data-driven improvements to the GTAP over the years include updated regional YDELs, land transformation elasticities, land intensification parameters, and yield improvements; and the inclusion of cropland pasture as a land type for the United States, Brazil, and Canada [35]. Models with these improvements have resulted in lower LUC values [7, 35]. For example, an adjustment to the land transformation parameter was made to account for the costliness associated with converting forest to cropland, relative to converting grassland [48, 107, 108]. The costs and resources associated with transforming forest to cropland, tend to deter farmers and result in the conversion of more feasible land types such as pasture. Including this realistic and logical observation in land transformation parameters results in a decreased likelihood of converting forest to cropland, ultimately lowering modeled LUC values [107]. ANL's dLUC model, CCLUB, has also been modified to include land management practices related to tillage and selection of soil depth, which influence SOC, and county-specific corn yield records of the modern agricultural period [33, 109]. Incorporating domestic land management practices that increase SOC and actual yield data play a role in lowering GHG emissions associated with LUC.
LUC emission estimates from ANL and USDA (including a prediction for 2022) from the last decade fall within our estimated range of −1.0–8.7 gCO2e MJ−1. Estimates from CARB (19.8 gCO2e MJ−1) and EPA (26.3 gCO2e MJ−1 predicted for 2022) fall outside our range, resembling LUC values from LCAs prior to 2011 (figure 1), and are based on modeling approaches that do not represent current best practices. EPA used two different models that have limitations compared to GTAP-BIO: (a) FASOM, which focuses on dLUC and has not been widely adopted in LCAs for corn ethanol; and (b) FAPRI, which predicts non-specific changes in crop acres and requires external input of MODIS satellite data to assign land types, resulting in unreliable emission estimates associated with LUC [47]. CARB used the GTAP-BIO model, but three out of five YDELs used for modeling (0.05, 0.10, 0.35) [53] fall outside our determined best practice range (0.175–0.325), and may not be representative of actual corn crop yields in response to price change. CARB also used an agro-ecological zone emission factor (AEZ-EF) model, which tends to generate higher LUC emissions primarily because of its treatment of cropland pasture. Emission factors in LUC modeling are used to assign carbon stock changes and emissions associated with reported LUCs. AEZ-EF assumes emissions from converting cropland pasture to cropland release 50% of the emissions associated with converting pasture to cropland [110]. However, emissions associated with conversion of cropland pasture to cropland are likely to be lower due to periodic tilling since cropland pasture typically 'shifts back and forth between cropland and grassland depending on the net returns' [111]. Additional emission factor models used in LUC modeling are Woods Hole, Winrock International, and CCLUB [33, 112, 113]. In conducting our review, we did not identify a comprehensive analysis which focused on the evaluation and utility of different LUC emission factors. To improve the characterization of LUC, we recommend future studies conduct a thorough review of the various emissions factors to assess the validity of their assumptions and functions.
Compared to estimates in earlier LCAs, more recent analyses indicate that LUC accounts for a small percentage (7%) of the overall CI of corn ethanol. A limitation of the current approach for predicting LUC in LCAs is that the resulting GHG emissions are presented as a static number. In reality, changes in land use, such as clearing of forest for farmland used for biofuel, create a carbon debt that can be repaid over time as biofuel displaces petroleum or other fossil fuels [27, 114]. The payback period is determined by the magnitude of the original debt and the size of the carbon dividend from the biofuel. In this context, the LUC carbon impact is a dynamic property that starts out as a large source, and eventually becomes a net carbon sink. The original analyses based upon this 'debt-dividend' framework suggested a payback period for corn ethanol of 48–167 years based upon a relatively small biofuel dividend. The latest LUC estimates described here suggest that the current biofuel dividend has increased since those early analyses. Thus, we recommend future research to update earlier analyses of carbon debt and dividend for corn ethanol as the timescale for ethanol production to become a net carbon sink from land use considerations may be considerably shorter than prior estimates. The updated analyses should incorporate recent data on the carbon content of Midwest prairie land and the net CI of corn ethanol farming and production relative to gasoline refined from petroleum.
Our analysis reviewed LCAs and LCA components conducted by researchers that primarily relied upon the GREET model, or a version of the GREET model (e.g. CA-GREET). It is important to acknowledge other international modeling tools that are available for developing a GHG emissions profile for corn ethanol, such as GaBi [115], GHGenius [116], and RenovCalc [117]. A comparative analysis of international LCA modeling tools would strengthen understanding of the CI for corn ethanol. Additionally, our findings pertain to the impacts from current and modest increases in production and consumption of corn ethanol on a gCO2e MJ−1 basis. A full consequential analysis is necessary to assess the effect of major increases in production and consumption (e.g. increasing the percent volume of ethanol in gasoline from 10% to 20%). A full consequential analysis would address constraints in the production system including land use availability, farming efficiencies (e.g. yield elasticity), and resources (e.g. water), as well as additional indirect emissions from changes in rice crop and livestock production and management. EPA and USDA estimated those two categories to contribute between 1.5 and 2.7 gCO2e MJ−1 [2, 7]. As part of a sensitivity analysis, we determined that including those two emission categories would increase our CI estimate by approximately 4%.
LCAs should also expand upon the latest empirical analyses of land use over time and across regions to characterize potential indirect LUC more accurately [56, 68, 69, 118]. The most comprehensive study we drew upon was conducted by Babcock and Iqbal in 2014 [68]. We recommend additional empirical LUC studies to be conducted that rely on recent and updated data sources, such as the Food and Agriculture Organization of the United Nations [119] and satellite data.
Our analysis on the state of the science of GHG emissions associated with the well-to-wheel life cycle of corn ethanol yielded a CI central estimate of 51.4 gCO2e MJ−1. We compared our central estimate to the average CI of neat gasoline, which ranges from 93 to 101 gCO2e MJ−1 [2, 120, 121], with an average of approximately 96 gCO2e MJ−1. Relative to the average CI of conventional gasoline, our central estimate for corn ethanol is 46% lower. These results are relevant to policy and commerce because CI estimates generated from LCAs are used to make significant biofuel policy and market decisions on state, national, and international levels. We recommend that comparative analyses of the CI for transportation fuels clearly note the system boundaries of the respective analyses as our review demonstrates that the consequential components of a LCA can strongly influence the resulting CI estimates.
5. Conclusion
Assessments of GHG intensity for corn ethanol have decreased by approximately 50% over the prior 30 years and converged on a current central estimate value of approximately 55 gCO2e MJ−1 which is over 40% lower on an energy equivalent basis than gasoline produced from crude oil. The decrease in GHG intensity is attributable to updates in modeling systems and input data that reflect market-driven changes in farming practices that lowered the use of fertilizer and fossil fuel on a per bushel basis, more efficient use of natural gas and more recent electric generation mix data for energy consumed at ethanol refineries, and market-based analyses of LUC. Current estimates from organizations in the United States are primarily based upon the GREET modeling system and show that direct emissions associated with production of corn and ethanol from corn, including co-product credits for animal feed and corn oil, account for approximately 80% of the total CI. Two independent sets of data relating to farming and ethanol production that we examined corroborate the results from GREET. Compared to farming and ethanol production, estimates of CI associated with LUC are more variable among recent LCAs, however, the most comprehensive evaluations indicate emissions are lower than 10 gCO2e MJ−1. Recent research indicates that market conditions that favor greater adoption of precision agriculture systems, retention of organic carbon in soil, and demand for co-products from ethanol production have the potential to reduce the CI of corn ethanol. Continued development and refinement of models to account for co-products, farming practices such as conservation of soil carbon, and direct and indirect LUC is expected to improve the accuracy of CI estimates in the future.
Acknowledgments
The authors are thankful to Dr Steffen Mueller, Ron Alverson, Thomas Darlington, Jeffrey Rosenfeld, and developers of GREET from ANL for valuable insights and suggestions.
Data availability statement
The data that support the findings of this study are available upon reasonable request from the authors.
Funding
This topical review was conducted by scientists and engineers at Environmental Health & Engineering, Inc. with financial support from POET, LLC.